

Pay Analysis
Why conduct a pay analysis?
A pay analysis helps executives understand whether full-time hourly employees earn enough money to support their household.
Many companies conduct competitor pay benchmark studies, but that doesn't take cost of living into consideration. Hourly wages don’t tell the whole story either because many full time workers get less than 40 hours of work. Looking at annual pre-tax pay allows companies to see if their workers are making a living wage.
DOWNLOad the template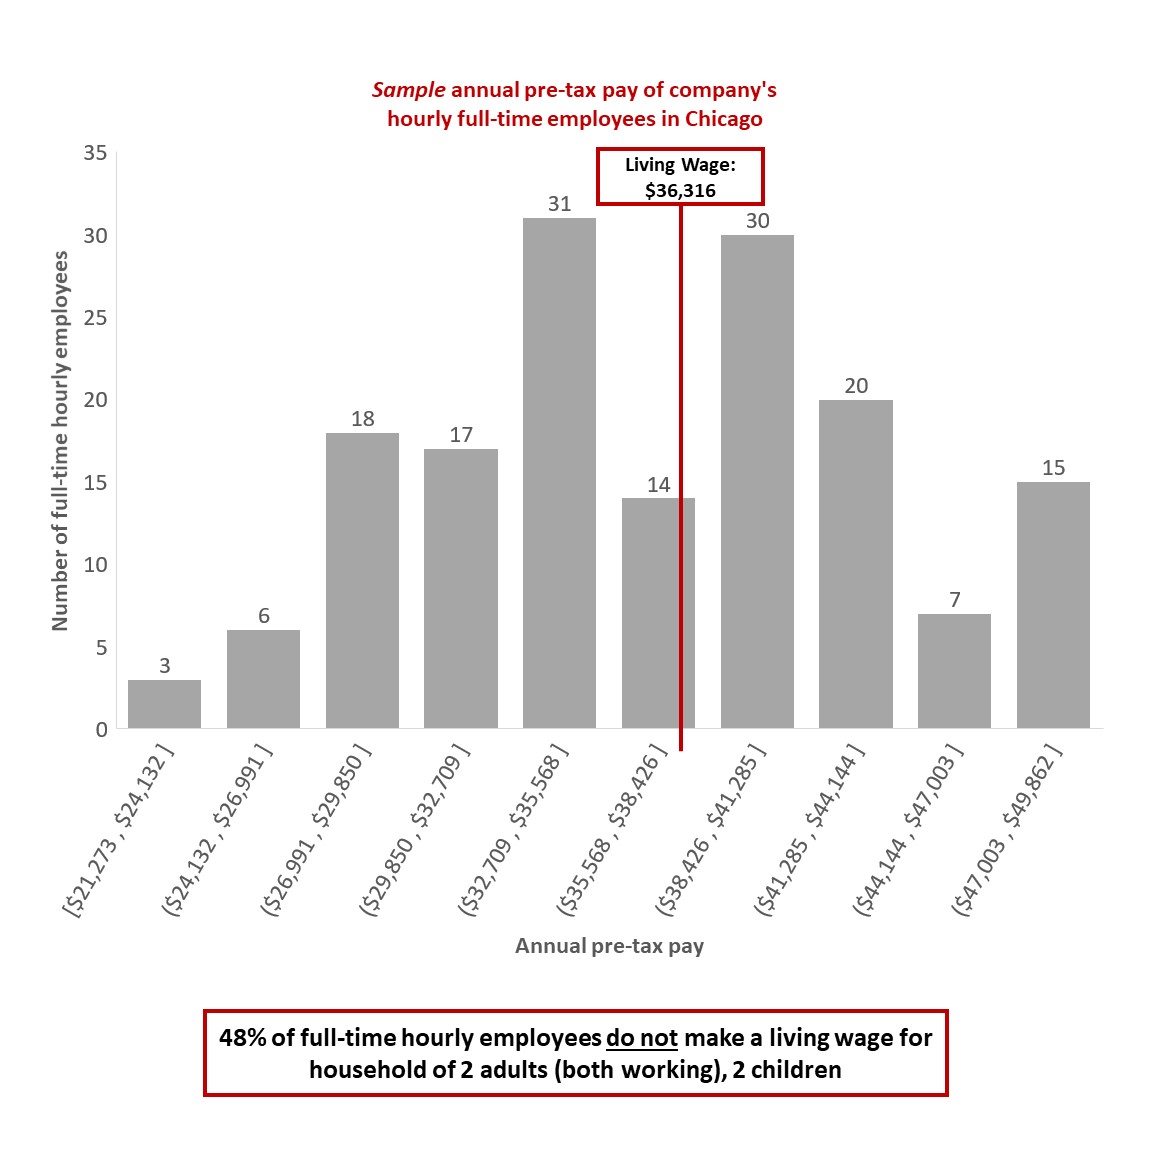
8 steps to conduct a pay analysis
To guide your pay analysis, download the template and follow these 8 steps. Reach out to us if you have questions or need support conducting this analysis.
1.
Determine the time period
We recommend looking at an entire year of data. If including a full year of data would substantially reduce the total number of employees active during the whole period, choose a representative month or quarter.
2.
Determine who will be included in the analysis
We recommend looking at all full-time hourly employees. If managers are paid by the hour, they should be included.
It is best to limit this to full-time hourly employees, but if most of your employees are part-timers, you can include them too. It's key that all of the employees you include were active employees for the whole time period you've chosen to analyze.
3.
Determine data categories to include
Analyzing pay data by role, business unit, gender, race, hire date/tenure, and any other relevant data categories can be illuminating so we recommend you include these categories in your data pull. You'll see these cells are "optional" on tab 1-4.
To do a living wage analysis (described in Step 6), you'll need to include data on each employee's county and/or state.
4.
Pull pre-tax pay data
With the filters you have selected in steps 1-3, gather the pay data for this employee set. You will need each individual's total pre-tax pay during the pay period. We recommend you also include two other data points for each employee: 1) total hours worked during the pay period and 2) the individual's average hourly wage.
5.
Look at the pay distribution
We recommend using a histogram to see the distribution. Large employee data sets can be unwieldy; this view of the data will allow you to confirm it looks accurate and see the pay distribution.
6.
Gather living wage data
The MIT Living Wage Calculator offers the hourly living wage required to support a household based on location; you can choose this data at the state, MSA, or county level. We recommend choosing the county. (Learn about the MIT Living Wage Calculator )
It also requires you to select the household size. For your analysis, you can choose a specific household size.
7.
Analyze the living wage data
Once you have gathered the living wage data, you need to do some analysis to answer How many / what % of your full-time hourly employees make a living wage?
Because the living wage only covers very basic expenses, you can also expand the range to understand the true financial precarity of your staff by answering How many of your full-time hourly employees make between 100-115% of the living wage ?
Tab 7 in the sample template shows the columns needed to do the living wage analysis. One important step is converting the hourly living wage to the living way pay for the amount of time you've selected. The living wage is calculated based on one year (40 hours of work a week for 52 weeks).
8.
Look at the data in a variety of ways
With the data you have collected, you can create additional analyses, such as pay by title, tenure, gender, race, etc. We also recommend looking at hours distribution.
You can see some examples on tab 8 in the sample template.
You've completed the analysis...
What do you do now?
You can refer to the summary tab in the downloadable template to share high-level data points from this analysis with your team, such as x% of full-time hourly employees make a living wage.
Good Jobs Institute uses think-cell to create visuals for client presentations.